Two weeks ago I wrote about high school star ratings and noted that along basically every measurable dimension (points, ORtg, minutes, aggressiveness), high school star ratings do a good job predicting college performance. Work ethic, skill and athleticism are on display in high school and scouting evaluations have predictive power at the next level. For example, here was the table for ORtg:
|
Avg ORtg |
Fr |
So |
Jr |
Sr |
|
2 Stars |
91.3 |
96.0 |
97.7 |
100.5 |
|
2 to 3 Stars |
93.8 |
98.6 |
101.2 |
102.0 |
|
3 Stars |
95.3 |
100.4 |
103.5 |
104.9 |
|
3 to 4 Stars |
97.0 |
103.2 |
105.3 |
106.2 |
|
4 Stars |
97.8 |
102.8 |
105.3 |
107.5 |
|
Over 4 Stars |
104.9 |
108.5 |
109.0 |
109.6 |
But if your team cannot attract elite talent, things are not hopeless. That is because there is a ton of variance in these outcomes.
The next two tables show how spread out these distributions can be. The first table shows the 25th percentile for each high school star rating and class. The table can be interpreted as follows. Twenty-five percent of players with two stars have an ORtg less than 82.4 in their freshmen season. Similarly 25 percent of players with two stars have an ORtg less than 93.1 as seniors.
|
25th Percentile |
Fr |
So |
Jr |
Sr |
|
2 Stars |
82.4 |
87.7 |
89.8 |
93.1 |
|
2 to 3 Stars |
84.3 |
91.9 |
94.0 |
96.0 |
|
3 Stars |
86.6 |
92.9 |
96.4 |
97.5 |
|
3 to 4 Stars |
89.2 |
97.1 |
98.9 |
100.9 |
|
4 Stars |
91.6 |
96.5 |
101.3 |
101.9 |
|
Over 4 Stars |
98.3 |
102.2 |
103.2 |
102.8 |
But as the 75th percentile shows, there are actually quite a few efficient players to be found at all levels. Twenty-five percent of two-star freshmen have an ORtgs above 101.1. And 25 percent of two-star seniors have ORtgs above 108.8.
|
75th Percentile |
Fr |
So |
Jr |
Sr |
|
2 Stars |
101.1 |
105.2 |
106.5 |
108.8 |
|
2 to 3 Stars |
102.4 |
106.7 |
108.7 |
109.2 |
|
3 Stars |
104.3 |
108.2 |
111.2 |
112.5 |
|
3 to 4 Stars |
106.2 |
111.8 |
112.7 |
113.0 |
|
4 Stars |
106.0 |
110.6 |
110.8 |
114.3 |
|
Over 4 Stars |
111.5 |
113.9 |
115.2 |
114.8 |
Quick aside for the statistically inclined: Except for the difference between “three to four” and “four stars” groups, you can run t-tests and show the differences in means are statistically significant at the five percent level. The sample sizes are large enough to conclude that the distributions really are different. But even if the means are different, there is plenty of variance in player outcomes.
This variation in efficiency is not driven by differences in aggressiveness. The two-star freshmen with ORtgs over 101.1 are not all passive players benefiting by only taking wide open shots. The numbers in the above tables change by less than 0.5 if I drop players that rarely shoot.
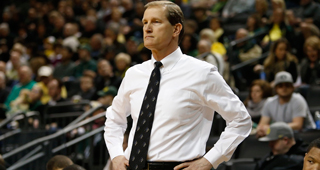
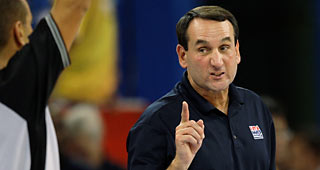
Now obviously part of what is going on is that players end up competing under different coaches, with different quality teammates, and against different quality competition. Some of the difference between the “over four-star” group and the “two-star” group is that the “over four-star” group is being taught by coaches like Mike Krzyzewski. The variation is not all random noise. But let’s assume for a moment that the variation in performance is relatively random. Then we can start to ask some simple questions.
What are the odds of finding a quality rotation player at each star rating?
The above tables provide some information, but let’s ask a more complicated question. What is the probability of finding a player who plays over 30 percent of the team’s minutes, is not overly passive (percentage of possessions over 15 percent), and whose ORtg is over 100? The next table shows the probability by star rating and class.
|
Player |
Fr |
So |
Jr |
Sr |
|
2 Stars |
10% |
20% |
28% |
36% |
|
2 to 3 Stars |
13% |
30% |
44% |
45% |
|
3 Stars |
16% |
37% |
45% |
50% |
|
3 to 4 Stars |
23% |
47% |
54% |
60% |
|
4 Stars |
28% |
51% |
66% |
73% |
|
Over 4 Stars |
58% |
79% |
83% |
80%* |
Two-star players are basically long-shots, and only 10 percent are quality rotation players as freshmen. But 36 percent of two-star players who stick around for their senior year are quality rotation players.
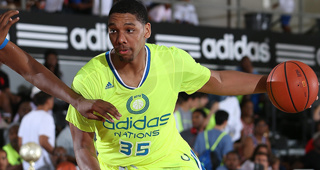
In contrast, in the “over four-star” group, 58 percent of freshmen are quality rotation players. (Among the failures, over 25 percent of these players have ORtgs below 100, and the rest either suffer injuries or get crunched out of the rotation on deep teams.) Even elite prospects are not guaranteed to contribute right away.
*The number of “over four-star” players who become quality rotation pieces by their senior year would be higher except that attrition knocks out many of the successes in the “over four-star” group. Many of the players in this group have left for the NBA before their senior season. When an “over four-star” player makes it to his senior season, he often has a story like Washington’s Abdul Gaddy. Gaddy was a consensus five-star recruit out of high school, but in part due to all the injuries in his career, his ORtg as a senior was under 100.
What are the odds of finding a star player at each star rating?
While it is nice to find a quality rotation player, the truth is that great seasons are built around outstanding players. There is no single formula for a star player, but in the next table I ask this question: What is the probability of finding a player who plays over 50 percent of the team’s minutes, is aggressive (percentage of possessions over 24 percent), and whose ORtg is over 110?
|
Outstanding Player |
Fr |
So |
Jr |
Sr |
|
2 Stars |
<1% |
1% |
2% |
3% |
|
2 to 3 Stars |
<1% |
1% |
3% |
3% |
|
3 Stars |
<1% |
2% |
4% |
5% |
|
3 to 4 Stars |
1% |
6% |
6% |
9% |
|
4 Stars |
<1% |
4% |
6% |
10% |
|
Over 4 Stars |
10%** |
16% |
12% |
14% |
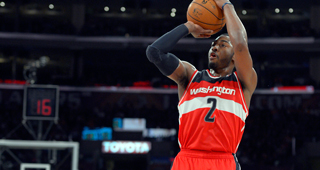
It is possible to find diamonds in the rough. For example, Andrew Goudelock, Norris Cole, Nate Wolters, CJ McCollum, Damian Lillard, Isaiah Canaan, Orlando Johnson and Kenneth Faried were all unheralded recruits out of high school. But the odds of finding a diamond in the rough are not great. By this definition of stardom, only three percent of two-star players become superstars as seniors. Similarly, only five percent of three-star players become superstars as seniors.
**This may not be the ideal definition for a superstar because of the aggressiveness cut-off. Kentucky might have five superstars on the team but due to sharing the ball, none might use over 24 percent of the team’s possessions. Still, for most teams, the star players will be aggressive players.
Now you might use this last table to argue that recruiting is not all that important. But moving from two-star to three-star recruits can nearly double the probability of finding an outstanding player, and over a 13-scholarship roster, these types of differences add up.
While nothing about recruiting is certain, and while some coaches can overcome recruiting inadequacies, the numbers are fairly clear. When it comes to finding superstars and quality rotation players, the odds of success are much higher the more quality recruits a program brings in.