This weekend Michigan St. beat Ohio St. by forcing Jared Sullinger to commit 10 turnovers, Texas Tech beat Oklahoma to become the final BCS team to win a conference game, Alabama head coach Anthony Grant suspended his four best players for a violation of team rules in a loss to LSU, and Texas had a huge comeback to beat Kansas St.
There were plenty of exciting games, from Louisville’s comeback against West Virginia to UNLV holding off San Diego St. on a last second steal. But the heart of the season is sort of an awkward mix. There aren’t very many surprises any more. (I already knew Florida and Creighton didn’t play defense.) And we are too far from Selection Sunday to make blanket statements. (I’m pretty sure Pittsburgh’s loss at Seton Hall means their NCAA hopes are over, but I’ll feel a lot more certain in a couple of weeks.) So rather than focus on what happened this weekend, let me spend a little time talking about some player data.
Understanding Breakout Offensive Players
College basketball fans might think that the major contribution of Dean Oliver is the creation of tempo free player statistics. But the “tempo free” part is actually a minor part of his ORtg formula. His key contribution was figuring out how to give players credit for assists and offensive rebounds. Clearly on a possession, the player who scores the basket might not be the only player who deserves credit for the points.
Let’s take North Carolina as an example. In this table ORB=Offensive Rebounds, AST=Assists, PTS=Points Scored, and PP=Points Produced.
|
|
PP |
||||
|
45 |
23 |
422 |
---> |
367 |
|
|
97 |
23 |
374 |
---> |
358 |
|
|
68 |
35 |
341 |
---> |
320 |
|
|
38 |
24 |
202 |
---> |
184 |
|
|
2 |
234 |
164 |
---> |
260 |
|
|
19 |
21 |
158 |
---> |
151 |
|
|
10 |
39 |
142 |
---> |
137 |
|
|
31 |
6 |
128 |
---> |
124 |
(Through Wed. Feb 8th)
In terms of actual points scored, Kendall Marshall is a relatively quiet scorer in North Carolina’s rotation. But because Kendall Marshall assists on so many baskets, in Dean Oliver’s formula, Marshall gets a lot of credit. When you look at the PP (points produced) column, Marshall gets credit for almost 100 more points on the season in Oliver’s formula. Basically everyone else has to share credit for their points with Marshall. So everyone else has lower PP relative to PTS. Offensive rebounding numbers work the same way. Because Zeller grabs more offensive rebounds than Harrison Barnes, he gets some credit back.
ORtg just takes PP and divides by the number of Possessions each player uses. If you produce 115 points and use 100 possessions, your ORtg is 115.
If you want to try and back out the “weights” for assists and offensive rebounds in Oliver’s formula, you cannot. Oliver’s formula isn’t linear. Also, if PP isn’t complicated enough, Possessions also must give credit for things like assists and offensive rebounds. If you check out Dean Oliver’s book “Basketball on Paper” from the library, you’ll see the full formula fills up about a page of text and takes a chapter to explain. It is ridiculously complicated, but it does do an incredible job assigning credit based on the stats in the box score.
If you’ve been following college basketball for awhile, you probably know who the breakout players are this season. But my goal today is to tell you why those players are breakout stars. At first, I thought about generating these types of tables:
Biggest Jump in Percentage of Possessions Used
|
Player |
Team |
PctPoss2011 |
PctPoss2012 |
RawChPctPoss |
|
Tim Frazier |
Penn St. |
18% |
33% |
15% |
|
Henry Sims |
Georgetown |
18% |
29% |
11% |
|
Josh Watkins |
Utah |
29% |
39% |
10% |
|
Austin Pehl |
Northern Iowa |
15% |
25% |
10% |
|
Michael Perez |
UTEP |
12% |
22% |
10% |
|
Nick Turner |
Kennesaw St. |
12% |
22% |
10% |
|
Patric Young |
Florida |
11% |
21% |
10% |
|
Jamaal Franklin |
San Diego St. |
20% |
30% |
9% |
|
Jamal Wilson |
Rhode Island |
18% |
27% |
9% |
|
Bernard Kamwa |
UMKC |
16% |
25% |
9% |
(Table includes only players with at least five games and a minimum of 25 possessions in both seasons in a top 18 conference.)
When 80% of Penn St.’s production graduated, Tim Frazier became a high volume shooter. One of Ken Pomeroy’s classic observations is that role players rarely become high volume shooters, but when teams lose high volume shooters to graduation, it sometimes happens. I could also create this type of table:
Biggest Jump in ORtg
|
Player |
Team |
ORtg2011 |
ORtg2012 |
RawChORtg |
|
Jeremy Jeffers |
Drake |
45.7 |
114.6 |
68.9 |
|
Reggie Smith |
UNLV |
66.8 |
119.1 |
52.3 |
|
Jerry Jones |
Duquesne |
71.3 |
120.2 |
48.8 |
|
Fred Gulley |
Oklahoma St. |
62.3 |
110.8 |
48.4 |
|
Kam Cerroni |
Green Bay |
79.4 |
122.4 |
43.0 |
|
Vincent Williams |
Georgia |
62.7 |
104.8 |
42.1 |
|
Jaquon Parker |
Cincinnati |
74.7 |
115.0 |
40.3 |
|
Tyler Storm |
Northern Illinois |
63.1 |
102.5 |
39.4 |
|
Delino Dear |
Toledo |
86.7 |
125.0 |
38.3 |
|
Adam Waddell |
Wyoming |
83.8 |
120.9 |
37.1 |
(Table includes only players with at least 5 games and a minimum of 25 possessions in both seasons in a top 18 conference.)
Jaquon Parker’s improvement in efficiency for Cincinnati seems very important, but has anyone even heard of Fred Gulley? (Hint: He transferred out of Oklahoma St. mid-year to attend Arkansas.) But because Gulley rarely played in either season, his explosion in ORtg isn’t terribly important. Now, I could make the list look a little more sensible with some strategic cut-offs. For example, I could require that players have over 40% of the team’s minutes in both seasons, ect. But that can be a bit of a puzzle because often breakout players go from few minutes to major minutes.
And that’s where the PP concept from the beginning of this article comes into play. Why not take PP per Game and see how and why that has changed for various players. (Remember this isn’t literally Points Per Game, this is the Dean Oliver concept of Points Produced per Game.)
Taking these numbers, who are the Top 20 breakout players this year? I not only identify the breakout players, I can also explain why their stats have improved:
ChangePPG: Total Change in Points Produced Per Game (with credit re-assigned for assists and offensive rebounds.) This has three components:
ChangeORTG: Given the players current role, how does the change in ORtg from last year impact the player’s Points Produced Per Game?
ChPossUsed: How does the change in percentage of shots taken (really possessions used) impact the player’s Points Produced Per Game?
ChPT: How does the player’s playing time (and team’s tempo) impact the Points Produced Per Game?
Top 20 Breakout Players
|
Player |
Team |
ChangePPG |
ChPT |
ChPossUsed |
ChangeORtg |
|
Jamaal Franklin |
San Diego St. |
12.4 |
8.0 |
5.0 |
-0.5 |
|
Tim Frazier |
Penn St. |
11.4 |
2.6 |
8.8 |
0.0 |
|
Meyers Leonard |
Illinois |
10.9 |
5.1 |
2.1 |
3.7 |
|
Jamal Wilson |
Rhode Island |
10.4 |
4.2 |
4.9 |
1.3 |
|
Bryce Cotton |
Providence |
10.0 |
5.2 |
3.8 |
1.0 |
|
Billy Baron |
Rhode Island |
10.0 |
6.4 |
1.6 |
2.0 |
|
Trae Golden |
Tennessee |
9.9 |
5.0 |
3.1 |
1.9 |
|
Keala King |
Arizona St. |
9.5 |
6.7 |
0.0 |
2.8 |
|
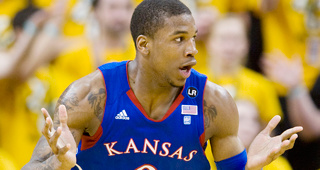
Thomas Robinson |
Kansas |
9.3 |
8.2 |
1.0 |
0.0 |
|
Michael Perez |
UTEP |
9.2 |
2.9 |
3.9 |
2.4 |
|
J'Covan Brown |
Texas |
9.2 |
5.7 |
2.4 |
1.2 |
|
Russ Smith |
Louisville |
9.1 |
6.9 |
0.8 |
1.4 |
|
Derrick Williams |
Richmond |
9.0 |
9.2 |
-0.2 |
0.1 |
|
Henry Sims |
Georgetown |
9.0 |
3.7 |
5.0 |
0.2 |
|
Brock Motum |
Washington St. |
8.9 |
4.5 |
4.9 |
-0.4 |
|
Jeronne Maymon |
Tennessee |
8.9 |
5.4 |
0.4 |
3.1 |
|
Terrell Stoglin |
Maryland |
8.5 |
4.6 |
2.8 |
1.1 |
|
Cedrick Lindsay |
Richmond |
8.4 |
4.7 |
2.9 |
0.8 |
|
Ryan Nicholas |
Portland |
8.4 |
6.5 |
1.5 |
0.3 |
|
Stephen Madison |
Idaho |
8.2 |
5.5 |
1.3 |
1.5 |
(Table is limited to Top 18 conferences.)
-With so many players graduating from San Diego St., Jamaal Franklin shoots a lot more often, and he plays a lot more minutes. His ORtg has slipped slightly, but that has only minimally held back his stats.
-Meyers Leonard isn’t necessarily being all that more aggressive on the floor, but he is converting at a higher rate, and playing more than last year.
-Thomas Robinson is no more efficient than last year, and while he is a little more aggressive in his shot selection, his main improvement in PP has come from additional playing time. (In other words, imagine what he could have done last year if he wasn’t stuck so low on the depth chart.)
Now, besides looking at the top overall improvements, we can also identify players where an improvement in ORtg has been the most critical:
Critical Improvements in Efficiency
|
Player |
Team |
ChangePPG |
ChPT |
ChPossUsed |
ChangeORtg |
|
Jeremy Jeffers |
Drake |
4.5 |
2.7 |
-1.9 |
3.7 |
|
Meyers Leonard |
Illinois |
10.9 |
5.1 |
2.1 |
3.7 |
|
Jeronne Maymon |
Tennessee |
8.9 |
5.4 |
0.4 |
3.1 |
|
Tony Chennault |
Wake Forest |
4.8 |
3.5 |
-1.5 |
2.9 |
|
Ceola Clark |
Western Illinois |
2.7 |
0.9 |
-1.1 |
2.9 |
|
Calvin Newell, Jr. |
Oklahoma |
6.3 |
2.4 |
1.0 |
2.9 |
|
Jaquon Parker |
Cincinnati |
6.1 |
3.6 |
-0.3 |
2.8 |
|
Keala King |
Arizona St. |
9.5 |
6.7 |
0.0 |
2.8 |
|
Adam Waddell |
Wyoming |
4.8 |
1.4 |
0.6 |
2.8 |
|
Joston Thomas |
Hawaii |
3.7 |
1.3 |
-0.3 |
2.7 |
|
C.J. Harris |
Wake Forest |
4.9 |
0.3 |
1.9 |
2.7 |
|
Dorian Green |
Colorado St. |
5.2 |
0.7 |
1.8 |
2.7 |
|
Doug McDermott |
Creighton |
5.9 |
2.2 |
1.1 |
2.6 |
|
Steven Pledger |
Oklahoma |
5.0 |
1.3 |
1.1 |
2.6 |
|
Deremy Geiger |
Idaho |
2.7 |
1.3 |
-1.2 |
2.6 |
|
Jerry Jones |
Duquesne |
5.1 |
2.3 |
0.2 |
2.6 |
|
Aloys Cabell |
Jacksonville |
7.0 |
4.9 |
-0.5 |
2.5 |
|
Djim Bandoumel |
Idaho |
4.9 |
5.6 |
-3.2 |
2.5 |
|
Michael Perez |
UTEP |
9.2 |
2.9 |
3.9 |
2.4 |
|
Will Barton |
Memphis |
6.2 |
2.0 |
1.8 |
2.4 |
(Table is limited to Top 18 conferences.)
Just to emphasize what this list means, this isn’t the players with the biggest improvements in ORtg, this is the list of players with big improvements in ORtg who also use a lot of possessions for their team.
Indiana’s Matt Roth improved his ORtg from 131 to 165 (which is mind-boggling), but he plays and shoots so rarely that his offensive improvement is only worth about 0.8 PPG to Indiana. Instead, Will Barton’s improvement in efficiency is much more important. Will Barton’s ORtg has improved from 99 to 114 and given his role in Memphis’ offense, that translates to about 2.4 PPG.
More to come on Thursday!
