The summer Olympics is a buffet of sports, and it is hard not to gorge yourself. One thing I’ve been wondering lately is why they don’t move some sports from the Summer Olympics to the Winter Olympics. Why does every winter sport have to involve snow or ice? Sure track & field, cycling, and archery make the most sense in the summer, but with so many of the sports in the Summer Olympics held indoors, some of them could be saved for the winter season. Take volleyball for example. Why not keep the beach volleyball in the summer, and stick the indoor team volleyball in the Winter Olympics?
My wife’s choice for a sport to save for the Winter Games would be fencing. My only concern with that is that I love the ridiculous Modern Pentathalon and all five disciplines are currently summer events. In case you’ve missed the jokes, Modern Pentathalon is that odd combination of fencing, swimming, equestrian jumping, shooting, and running. (And it used to include wrestling.) Every sports writer has to include Modern Pentathalon in one of their columns at some point and this now completes my obligation. But no one ever seems to explain why it was created! It was designed to recreate what it was like to be a soldier behind enemy lines in the 19th century. I.e., a soldier might have to fence, shoot, ride an unfamiliar horse, swim, and run to safety. And my foolish desire to watch these type of novelty events meant I didn’t watch nearly as many hours of basketball as I might have wanted.
Top 40
Regardless, let’s take one last look back at some of the top player performances in the Olympic basketball tournament. Today’s column is about worlds colliding. I bridge the gap between the traditional stat Points Per Game (PPG) and the tempo free stat ORtg. For those of you who are new to this, ORtg approximates points produced per 100 possessions, giving credit to teammates for assists and offensive rebounds.
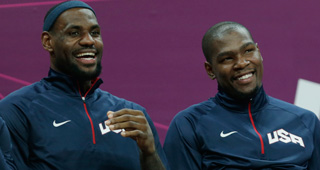
The next table has been a long time idea of mine, and if I was Ken Pomeroy, you might see this more regularly. After PPG, we have Points Produced Per Game (PPPG) which factors in those assists and offensive rebounds. So for a stat-stuffer like LeBron James, his PPPG is greater than his PPG. (This is true for almost all point guards.) Meanwhile pure shooters tend to see their totals decreased. Players also get credit for offensive rebounding, but as in the case of Kevin Love, when you never get any assists, you actually end up about the same with either measure. Players like Kevin Durant that don’t crash the offensive glass or dish assists, tend to see their PPPG is substantially lower since they are sharing credit with their teammates. In the remaining columns PPPG is separated into shot opportunities and ORtg. The three ways you get shot opportunities are your team’s pace, your percentage of minutes, and the percentage of possessions you use when on the floor.
|
|
|
|
Shot Opportunities |
|
|
||
|
Name |
PPG |
PPPG |
Pace |
PctMin |
PctPoss |
ORtg |
Country |
|
P MILLS |
21.2 |
18.5 |
79 |
75% |
31% |
102.1 |
Australia |
|
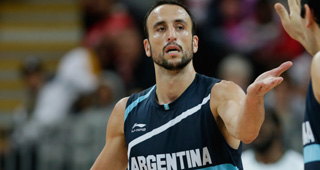
M GINOBILI |
19.4 |
18.4 |
77 |
76% |
27% |
118.2 |
Argentina |
|
L SCOLA |
18.0 |
17.4 |
77 |
75% |
28% |
111.5 |
Argentina |
|
P GASOL |
19.1 |
17.0 |
74 |
71% |
27% |
122.1 |
Spain |
|
K DURANT |
19.5 |
16.8 |
85 |
65% |
22% |
142.3 |
US |
|
L DENG |
15.8 |
16.6 |
76 |
87% |
28% |
91.9 |
G. Britain |
|
A KIRILENKO |
17.5 |
16.5 |
75 |
85% |
23% |
114.5 |
Russia |
|
L. JAMES |
13.3 |
15.5 |
85 |
63% |
20% |
148.0 |
US |
|
M B ROMDHANE |
15.0 |
15.4 |
72 |
84% |
29% |
89.1 |
Tunisia |
|
T PARKER |
15.7 |
15.4 |
75 |
76% |
28% |
95.9 |
France |
|
J INGLES |
15.0 |
14.9 |
79 |
84% |
20% |
115.6 |
Australia |
|
YI J |
14.8 |
14.8 |
73 |
83% |
25% |
98.7 |
China |
|
I DIOGU |
14.8 |
13.7 |
75 |
81% |
22% |
105.6 |
Nigeria |
|
C ANTHONY |
16.3 |
13.5 |
85 |
44% |
26% |
138.2 |
US |
|
N BATUM |
15.5 |
13.2 |
75 |
68% |
22% |
117.7 |
France |
|
M HUERTAS |
11.3 |
13.2 |
75 |
65% |
25% |
109.2 |
Brazil |
|
J FREELAND |
14.6 |
13.2 |
76 |
63% |
26% |
108.1 |
G. Britain |
|
C DELFINO |
15.3 |
12.9 |
77 |
79% |
19% |
110.7 |
Argentina |
|
L KLEIZA |
13.8 |
12.8 |
77 |
67% |
24% |
104.4 |
Lithuania |
|
A SHVED |
11.4 |
12.8 |
75 |
63% |
29% |
94.8 |
Russia |
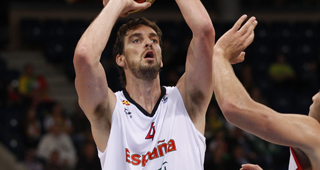
Pau Gasol’s performance in the third quarter of the gold medal game was epic, but it was not his only strong play in the tournament. Overall Gasol played major minutes, had to be the primary offensive weapon on his team, and still kept his ORtg at 122.1. When Olympic soccer was restricted to players 23 and under, one of the big mysteries to me was why Olympic soccer allowed three exceptions for older players. But with the NBA threatening to keep its veteran players from Olympic competition, I suddenly see the value in the exception rule. Sure, let the young players play, but make sure every international team has access to its biggest stars. Let Spain have Pau Gasol; let Argentina have Manu Ginobili; let France have Tony Parker; let Russia have Andrei Kirilenko; and let the US team have LeBron; and then surround them with college age stars. That would essentially be the Olympic soccer format, and it could still be very entertaining. But banning all players over 23 would clearly cause the casual fans to tune out.
It is tempting to say that Luol Deng’s production is overrated since he needed a ton of possessions to get those points. His 91.9 ORtg is distressing. But when you consider how overmatched many of the British players were, Deng needed to be that aggressive and he needed to play that many minutes. His iron man status while drawing constant defensive attention still deserves some praise. Australia’s Joe Ingles and Russia’s Andrei Kirilenko were also iron men in these games, seeing the court over 84% of the time for their teams.
Patrick Mills was the only rotation player to use over 30% of his team’s possessions in the Olympics. And of course, Kevin Durant and LeBron James’ have the best ORtgs in the first group. Carmelo Anthony’s production might be even more impressive when you see how few minutes he played. Sure, most of Anthony’s production came against Nigeria, but that was one fine game of basketball. Kevin Love has been plenty efficient too, as the next chart shows:
|
Name |
PPG |
PPPG |
Pace |
PctMin |
PctPoss |
ORtg |
Country |
|
L BARBOSA |
16.2 |
12.7 |
75 |
64% |
26% |
104.1 |
Brazil |
|
M GASOL |
12.6 |
11.5 |
74 |
66% |
24% |
101.6 |
Spain |
|
D ANDERSEN |
12.0 |
11.3 |
79 |
64% |
23% |
96.8 |
Australia |
|
S MEJRI |
10.4 |
11.1 |
72 |
81% |
22% |
87.1 |
Tunisia |
|
K LOVE |
11.6 |
11.1 |
85 |
43% |
21% |
147.5 |
US |
|
K BRYANT |
12.1 |
11.0 |
85 |
44% |
25% |
120.6 |
US |
|
D WILLIAMS |
9.0 |
10.8 |
85 |
45% |
22% |
127.9 |
US |
|
T SPLITTER |
10.8 |
10.7 |
75 |
58% |
24% |
102.6 |
Brazil |
|
C OGUCHI |
12.0 |
10.4 |
75 |
54% |
24% |
110.8 |
Nigeria |
|
C PAUL |
8.3 |
10.1 |
85 |
64% |
14% |
129.9 |
US |
|
V FRIDZON |
11.5 |
10.0 |
75 |
55% |
20% |
122.2 |
Russia |
|
D OBASOHAN |
10.6 |
9.5 |
75 |
76% |
19% |
89.1 |
Nigeria |
|
B DIAW |
7.7 |
9.4 |
75 |
72% |
16% |
107.5 |
France |
|
R FERNANDEZ |
9.6 |
9.4 |
74 |
67% |
16% |
116.4 |
Spain |
|
A NOCIONI |
10.4 |
9.1 |
77 |
65% |
17% |
108.7 |
Argentina |
|
AF AMINU |
7.8 |
9.0 |
75 |
72% |
22% |
75.3 |
Nigeria |
|
P M-BONSU |
9.2 |
8.9 |
76 |
56% |
22% |
98.8 |
G. Britain |
|
D SONGAILA |
11.0 |
8.8 |
77 |
40% |
21% |
137.3 |
Lithuania |
|
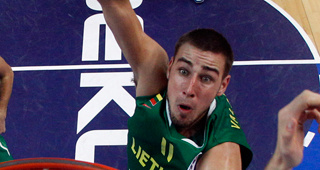
S JASIKEVICIUS |
6.8 |
8.7 |
77 |
54% |
26% |
81.3 |
Lithuania |
|
M DELLAVEDOVA |
7.3 |
8.7 |
79 |
72% |
15% |
101.5 |
Australia |
Al-Farouq Aminu and Sarinus Jasikevicius stand out for their particularly disastrous ORtgs. Sure, they were among the top 40 points producers, but both hurt their teams more than they helped with their poor shooting and poor turnover numbers.
I love that Deron Williams and Kobe Bryant essentially had the same production in the US offense, but that Kobe needed more possessions to get his points. Williams didn’t always play well. I thought some of his passing in the gold medal game was sloppy, and his dunk attempt at the end of the third quarter was questionable. But with his great assist totals throughout the tournament and his 41% three-point shooting, he was a more valuable offensive player for the US team. Chris Paul was unbelievably passive in this tournament which explains why he actually produced fewer points than Williams and Bryant. But when the tournament was on the line, Paul came up with a few huge baskets in the gold medal game.
The next table sorts by ORtg instead of PPPG. Not surprisingly, LeBron James was the most efficient player on the court in the Olympics. Was there ever any doubt?
|
Name |
PPG |
PPPG |
Pace |
PctMin |
PctPoss |
ORtg |
Country |
|
L JAMES |
13.3 |
15.5 |
85 |
63% |
20% |
148.0 |
US |
|
K LOVE |
11.6 |
11.1 |
85 |
43% |
21% |
147.5 |
US |
|
K DURANT |
19.5 |
16.8 |
85 |
65% |
22% |
142.3 |
US |
|
C ANTHONY |
16.3 |
13.5 |
85 |
44% |
26% |
138.2 |
US |
|
D SONGAILA |
11.0 |
8.8 |
77 |
40% |
21% |
137.3 |
Lithuania |
|
A VAREJAO |
7.3 |
8.4 |
75 |
50% |
17% |
135.8 |
Brazil |
|
C PAUL |
8.3 |
10.1 |
85 |
64% |
14% |
129.9 |
US |
|
D WILLIAMS |
9.0 |
10.8 |
85 |
45% |
22% |
127.9 |
US |
|
F CAMPAZZO |
4.6 |
6.0 |
77 |
48% |
13% |
127.3 |
Argentina |
|
V FRIDZON |
11.5 |
10.0 |
75 |
55% |
20% |
122.2 |
Russia |
|
P GASOL |
19.1 |
17.0 |
74 |
71% |
27% |
122.1 |
Spain |
|
J GUTIERREZ |
6.3 |
5.4 |
77 |
28% |
21% |
121.9 |
Argentina |
|
K BRYANT |
12.1 |
11.0 |
85 |
44% |
25% |
120.6 |
US |
|
R WESTBROOK |
8.5 |
8.0 |
85 |
34% |
23% |
118.4 |
US |
|
S IBAKA |
8.0 |
7.5 |
74 |
38% |
23% |
118.4 |
Spain |
|
M GINOBILI |
19.4 |
18.4 |
77 |
76% |
27% |
118.2 |
Argentina |
|
N BATUM |
15.5 |
13.2 |
75 |
68% |
22% |
117.7 |
France |
A bigger question might be why Serge Ibaka of Spain and Darius Songalia of Lithuania were buried on the bench. It nearly took Marc Gasol fouling out in the first half of the game for the Spanish coach to finally give Ibaka a chance against the US team.
But these are the Olympics, and you never know what sort of lineup decisions teams will make. On Saturday in the women’s handball bronze medal game, Spain had a back-up goalie who was only used for penalty shots. And her reaction time was outstanding! It makes you wonder why she wasn’t starting. Or rather, it probably makes you wonder why I was watching the women’s handball bronze medal game. Hey, move some of this stuff to the Winter Olympics, the summer smorgasbord was just too good.