The numbers that suggest Mark Few and Sean Miller are the best active coaches without a Final Four appearance, plus more on Okafor, Blackshear, and the Elite Eight. Read more »
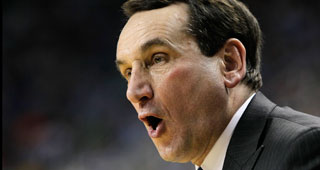
How Tom Izzo, Rick Pitino, and Mike Krzyzewski ended up in another Elite Eight, and how Mark Few made the Elite Eight for the first time since 1999. Read more »
Looking back at Michigan St.'s upset, Seth Tuttle's last game, the frustrating reality for Dayton fans, and the two-game numbers for every remaining tournament team. Read more »
On teams that have been lucky/unlucky on margin of victory, why this might be a year to pick more chalk and final thoughts on the final day of the conference tournaments. Read more »
This seems like the kind of list that should be compiled in December. Only after the grind of conference play do we really find out which players took their game to the next level. Read more »
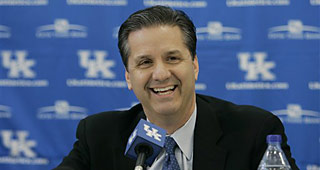
With three marquee basketball games staggered throughout the day, #10 Northern Iowa at #11 Wichita St., #18 Arkansas at #1 Kentucky, and #7 Arizona at #13 Utah, Saturday seemed like the perfect day to write a noon to midnight recap. Read more »
On an overtime thriller at Cameron Indoor Stadium between the Blue Devils and Tar Heels, as well as the freshmen that entered the season ranked 21-40. Read more »