When projecting cap space for the summer of 2018, one major theme has emerged: the NBA has settled back into its steady state, where the vast majority of the league is capped out, and only a few teams have meaningful cap space.
Approximately 80 percent of the league will be over the cap. The cap spike that caused multiple teams to have copious amounts of cap space each summer from 2015 through 2017 has now flattened out. Large contracts the were handed out over the previous three years, combined with the cap flattening and the increase in rookie scale deals, will see the NBA back to its regular state.
As it was before the spike, a handful of teams will be angling towards cap space. This group includes several teams that aren’t trying overly hard to win (read: tanking), but also a couple of playoff teams and a team on the rise. The Indiana Pacers face an interesting summer, due to several partially guaranteed contracts that they can easy shed to increase their available cap space. That means the Pacers can get to almost $33 million in cap space. Despite never being an overly hot free agent destination, Indiana could be in the mix, simply due to having enough space to pursue a max free agent.
The Philadelphia 76ers, having signed Joel Embiid and Robert Covington to extensions, can get to nearly $23 million in cap space by renouncing some veteran free agents. If they can’t land the big free agent they are chasing, the Sixers can then work out short-term contracts for role playing veterans, similar to last offseason.
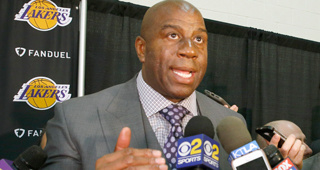
And then there is the Los Angeles Lakers. Last summer, it was rumored that Los Angeles would chase not one, but two max free agents in 2018. The Lakers were even fined by the NBA for being overly transparent in their pursuit of Paul George. Around midseason it was reported the Lakers were backing off that and they were thinking more about the summer of 2019. But with nearly $58 million in available cap space (more if they waive and stretch Luol Deng) and arguably playing in the NBA’s best market, the Lakers will have a major say in free agency.
The rest of the cap space group involves lottery teams: the Atlanta Hawks, Sacramento Kings, Brooklyn Nets and Chicago Bulls. Those four all have between $12 and $29 million in space, but none are quite ready to add a major free agent to the mix. But as other teams look to shed salaries, these four could be ready to take on a bad contract or two, while also acquiring valuable first round draft picks.
In addition, for the first time in years, no team is guaranteed to start the summer with at least some cap space. In recent years, Brooklyn and Philadelphia have been virtual locks to have space to start out the summer. With both franchises having made trades, signings and, in the case of the 76ers, high draft picks, they are positioned to start the summer over the cap.
With very few teams projected to have cap space, this means that some roster building tools that have fallen out of use for the last few years will be back en vogue. Sign-and-trade transactions will again become a useful way for players to pick a new team. It is fair to expect the Non-Taxpayer and Taxpayer Mid-Level Exceptions to be heavily used. They project to be $8.6 and $5.3 million respectively. Even the Bi-Annual Exception, which has been rarely used in recent years, could become a factor again. It projects to have a value of $3.4 million.
And, of course, the trade market should be booming. When teams don’t have cap space, trades are often the best way for players to move to new destinations. This means that teams who are sitting on extra draft picks and/or talented young players, but lack cap space, should be active in trade talks.
A few notes on the projections in the tables:
- Latest cap projection of $101 million is used.
- Rookie Scale, Minimum Scale and Exceptions all bump up accordingly with percentage of the cap increase.
- Projections are made on which options will be picked up, both player and team and which partial/non-guaranteed players will be waived or kept.
- No extension projections are made.
- Cap holds for first round draft picks are based on the standings as of 3/10/18.
- Starting Cap Space = the amount of space each team will have without renouncing or waiving any players/picks.
- Maximum Cap Space = the amount of space each team could have if they waived or renounced all players/picks who are not fully guaranteed.
- Projected Cap Space = the amount of space each team is projected to have after roster decisions are made.
|
Team |
Starting |
Maximum |
Projected |
|
Atlanta |
$ (3,787,914) |
$ 40,610,530 |
$ 29,322,094 |
|
Boston |
$ (35,719,157) |
$ (6,976,010) |
$ (35,719,157) |
|
Brooklyn |
$ (15,730,164) |
$ 16,556,248 |
$ 14,218,938 |
|
Charlotte |
$ (32,715,612) |
$ (17,753,513) |
$ (29,716,216) |
|
Chicago |
$ (9,765,633) |
$ 41,402,842 |
$ 12,579,952 |
|
Cleveland |
$ (58,188,242) |
$ (3,862,674) |
$ (58,188,242) |
|
Dallas |
$ (12,224,256) |
$ 53,080,194 |
$ (5,481,866) |
|
Denver |
$ (36,467,735) |
$ 12,896,699 |
$ (27,510,560) |
|
Detroit |
$ (27,567,999) |
$ (13,468,178) |
$ (27,567,999) |
|
Golden State |
$ (60,074,498) |
$ (5,248,010) |
$ (60,074,498) |
|
Houston |
$ (43,271,307) |
$ 17,274,981 |
$ (43,271,307) |
|
Indiana |
$ (11,152,245) |
$ 54,436,468 |
$ 32,800,518 |
|
LA Clippers |
$ (53,100,880) |
$ 36,937,244 |
$ (44,126,010) |
|
LA Lakers |
$ (33,532,883) |
$ 59,071,792 |
$ 58,367,683 |
|
Memphis |
$ (17,511,491) |
$ (2,599,669) |
$ (17,511,491) |
|
Miami |
$ (33,820,576) |
$ (17,744,022) |
$ (33,721,398) |
|
Milwaukee |
$ (32,535,467) |
$ (5,528,192) |
$ (32,535,467) |
|
Minnesota |
$ (37,976,910) |
$ (14,354,238) |
$ (32,427,710) |
|
New Orleans |
$ (34,673,717) |
$ 4,052,822 |
$ (34,673,717) |
|
New York |
$ (21,151,115) |
$ 25,125,815 |
$ (8,355,365) |
|
Oklahoma City |
$ (64,938,219) |
$ 8,767,534 |
$ (57,516,359) |
|
Orlando |
$ (19,427,816) |
$ 20,494,101 |
$ (19,427,816) |
|
Philadelphia |
$ (23,820,183) |
$ 31,113,820 |
$ 22,853,313 |
|
Phoenix |
$ (10,609,109) |
$ 27,838,832 |
$ (10,609,109) |
|
Portland |
$ (42,659,741) |
$ (12,781,270) |
$ (42,659,741) |
|
Sacramento |
$ (11,130,973) |
$ 53,316,783 |
$ 20,742,529 |
|
San Antonio |
$ (46,506,533) |
$ 18,432,451 |
$ (40,402,027) |
|
Toronto |
$ (43,194,987) |
$ (27,407,343) |
$ (43,194,987) |
|
Utah |
$ (28,695,058) |
$ 21,698,077 |
$ (28,695,058) |
|
Washington |
$ (36,736,399) |
$ (18,221,741) |
$ (34,900,399) |
Sorted by Starting Cap Space
|
Team |
Starting |
|
Atlanta |
$ (3,787,914) |
|
Chicago |
$ (9,765,633) |
|
Phoenix |
$ (10,609,109) |
|
Sacramento |
$ (11,130,973) |
|
Indiana |
$ (11,152,245) |
|
Dallas |
$ (12,224,256) |
|
Brooklyn |
$ (15,730,164) |
|
Memphis |
$ (17,511,491) |
|
Orlando |
$ (19,427,816) |
|
New York |
$ (21,151,115) |
|
Philadelphia |
$ (23,820,183) |
|
Detroit |
$ (27,567,999) |
|
Utah |
$ (28,695,058) |
|
Milwaukee |
$ (32,535,467) |
|
Charlotte |
$ (32,715,612) |
|
LA Lakers |
$ (33,532,883) |
|
Miami |
$ (33,820,576) |
|
New Orleans |
$ (34,673,717) |
|
Boston |
$ (35,719,157) |
|
Denver |
$ (36,467,735) |
|
Washington |
$ (36,736,399) |
|
Minnesota |
$ (37,976,910) |
|
Portland |
$ (42,659,741) |
|
Toronto |
$ (43,194,987) |
|
Houston |
$ (43,271,307) |
|
San Antonio |
$ (46,506,533) |
|
LA Clippers |
$ (53,100,880) |
|
Cleveland |
$ (58,188,242) |
|
Golden State |
$ (60,074,498) |
|
Oklahoma City |
$ (64,938,219) |
Sorted by Maximum Cap Space
|
Team |
Maximum |
|
LA Lakers |
$ 59,071,792 |
|
Indiana |
$ 54,436,468 |
|
Sacramento |
$ 53,316,783 |
|
Dallas |
$ 53,080,194 |
|
Chicago |
$ 41,402,842 |
|
Atlanta |
$ 40,610,530 |
|
LA Clippers |
$ 36,937,244 |
|
Philadelphia |
$ 31,113,820 |
|
Phoenix |
$ 27,838,832 |
|
New York |
$ 25,125,815 |
|
Utah |
$ 21,698,077 |
|
Orlando |
$ 20,494,101 |
|
San Antonio |
$ 18,432,451 |
|
Houston |
$ 17,274,981 |
|
Brooklyn |
$ 16,556,248 |
|
Denver |
$ 12,896,699 |
|
Oklahoma City |
$ 8,767,534 |
|
New Orleans |
$ 4,052,822 |
|
Memphis |
$ (2,599,669) |
|
Cleveland |
$ (3,862,674) |
|
Golden State |
$ (5,248,010) |
|
Milwaukee |
$ (5,528,192) |
|
Boston |
$ (6,976,010) |
|
Portland |
$ (12,781,270) |
|
Detroit |
$ (13,468,178) |
|
Minnesota |
$ (14,354,238) |
|
Miami |
$ (17,744,022) |
|
Charlotte |
$ (17,753,513) |
|
Washington |
$ (18,221,741) |
|
Toronto |
$ (27,407,343) |
Sorted by Projected Cap Space
|
Team |
Projected |
|
LA Lakers |
$ 58,367,683 |
|
Indiana |
$ 32,800,518 |
|
Atlanta |
$ 29,322,094 |
|
Philadelphia |
$ 22,853,313 |
|
Sacramento |
$ 20,742,529 |
|
Brooklyn |
$ 14,218,938 |
|
Chicago |
$ 12,579,952 |
|
Dallas |
$ (5,481,866) |
|
New York |
$ (8,355,365) |
|
Phoenix |
$ (10,609,109) |
|
Memphis |
$ (17,511,491) |
|
Orlando |
$ (19,427,816) |
|
Denver |
$ (27,510,560) |
|
Detroit |
$ (27,567,999) |
|
Utah |
$ (28,695,058) |
|
Charlotte |
$ (29,716,216) |
|
Minnesota |
$ (32,427,710) |
|
Milwaukee |
$ (32,535,467) |
|
Miami |
$ (33,721,398) |
|
New Orleans |
$ (34,673,717) |
|
Washington |
$ (34,900,399) |
|
Boston |
$ (35,719,157) |
|
San Antonio |
$ (40,402,027) |
|
Portland |
$ (42,659,741) |
|
Toronto |
$ (43,194,987) |
|
Houston |
$ (43,271,307) |
|
LA Clippers |
$ (44,126,010) |
|
Oklahoma City |
$ (57,516,359) |
|
Cleveland |
$ (58,188,242) |
|
Golden State |
$ (60,074,498) |